How to use the Mandelbrot Set Explorer
|
Computation Limit:
|

|
The computation limit has a dropdown menu starting from 128, then 256, 512, 1,024, all the way up
to 1,048,576 reiterations. The default at startup is 512. You may notice that each of these
numbers is 2 to the power of something. For example: 128 = 2
7. If there are large
areas of the display in the “Mandelbrot Set” or numbers that are very near to the numbers that are
included in the Mandelbrot Set (deep areas), it will take longer to produce an image.
Adjusting the computation limit up will give you the ability to see into these deep areas and this ability
to change the computation limit is available even in mid computation, this will speed up the process
and give you the best possible experience.

|
The Show Grid / Hide Grid button will display and hide a grid that shows the values of the
“x” and “y” axes (real and imaginary axes). This can be used in add of navigation.
|
Colours:
|
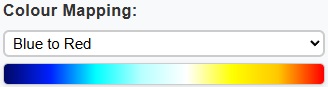
There are several colour maps to choose from via a drop-down menu. With each colour map there
is a preview that will show you the spread and arrangement of the colours to be used.
|
Available Colour Maps:












Colour Compression/Expansion
The compression/expansion slider sets the period of the colour cycle. For the ease of level selection,
the scale is set on a near linear to logarithmic scale dependent on the computation limit. Fully left
means that the colours are compressed to the point where each iteration level will receive its own colour
of the 8 predetermined colours of the chosen colour map, repeating for all iterations. Fully right means
that the colours are expanded across all iteration levels out to the computation limit, smoothly
transitioning between colours.
Compressed
 Expanded

Colour Progression
The progression slider allows you to roll the colours through the iteration levels.
Progression = 0%
Progression = 50%

|
Colour of Numbers in the Set:
|

|
Numbers in the set are the numbers that stay small after all the iteration are completed up to
the point of the Computation Limit. Each colour map has a colour assigned to the “Numbers in
the Mandelbrot set”, however, you are also given the option to change that colour to anything
you choose. Note that if you change the colour map, this colour will revert to the assigned
colour for that colour map.
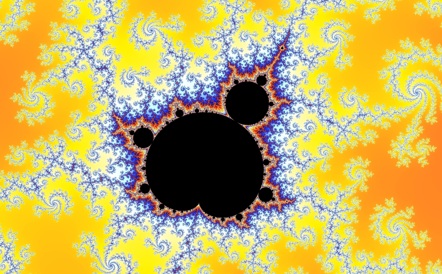
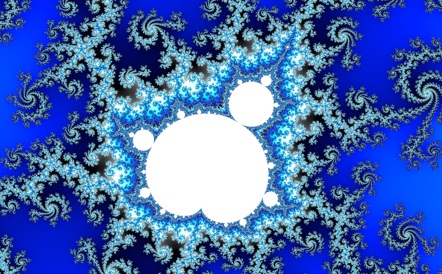
Use colour compression, expansion, progression, and an appropriate colour map,
to optimise the appeal of the image.
Julia Set

While the “Generate Julia Set” function is active, a small live preview window will follow the pointer and
compute the Julia set with parameter c for the coordinate of the cursor. Clicking will open a new tab for
the Julia Set page using the seedy chosen coordinate as the seed point.
Image Export:
This page can export an image in either .jpeg or .png format. The image will be generated from scratch at
the chosen scale (0.25× – 8×) at the full resolution for that image dimensions.
File Name:
The default file name for the exported image is “Mandelbrot_[x-centre]+[y-centre]i”, where [x-centre] is
the x coordinate of the centre of the image and [y-centre] is the y coordinate of the centre of the image.
If you change the file name, it stays changed. If you wish to change back to the default name just type in
“Mandelbrot_” and it will use the default naming convention once more.
Coordinates:

The Coordinates box displays the x and y coordinates of the display area to 10 decimal places.
This can be helpful in navigation.
© 2025 Richard Faulks. All Rights Reserved.